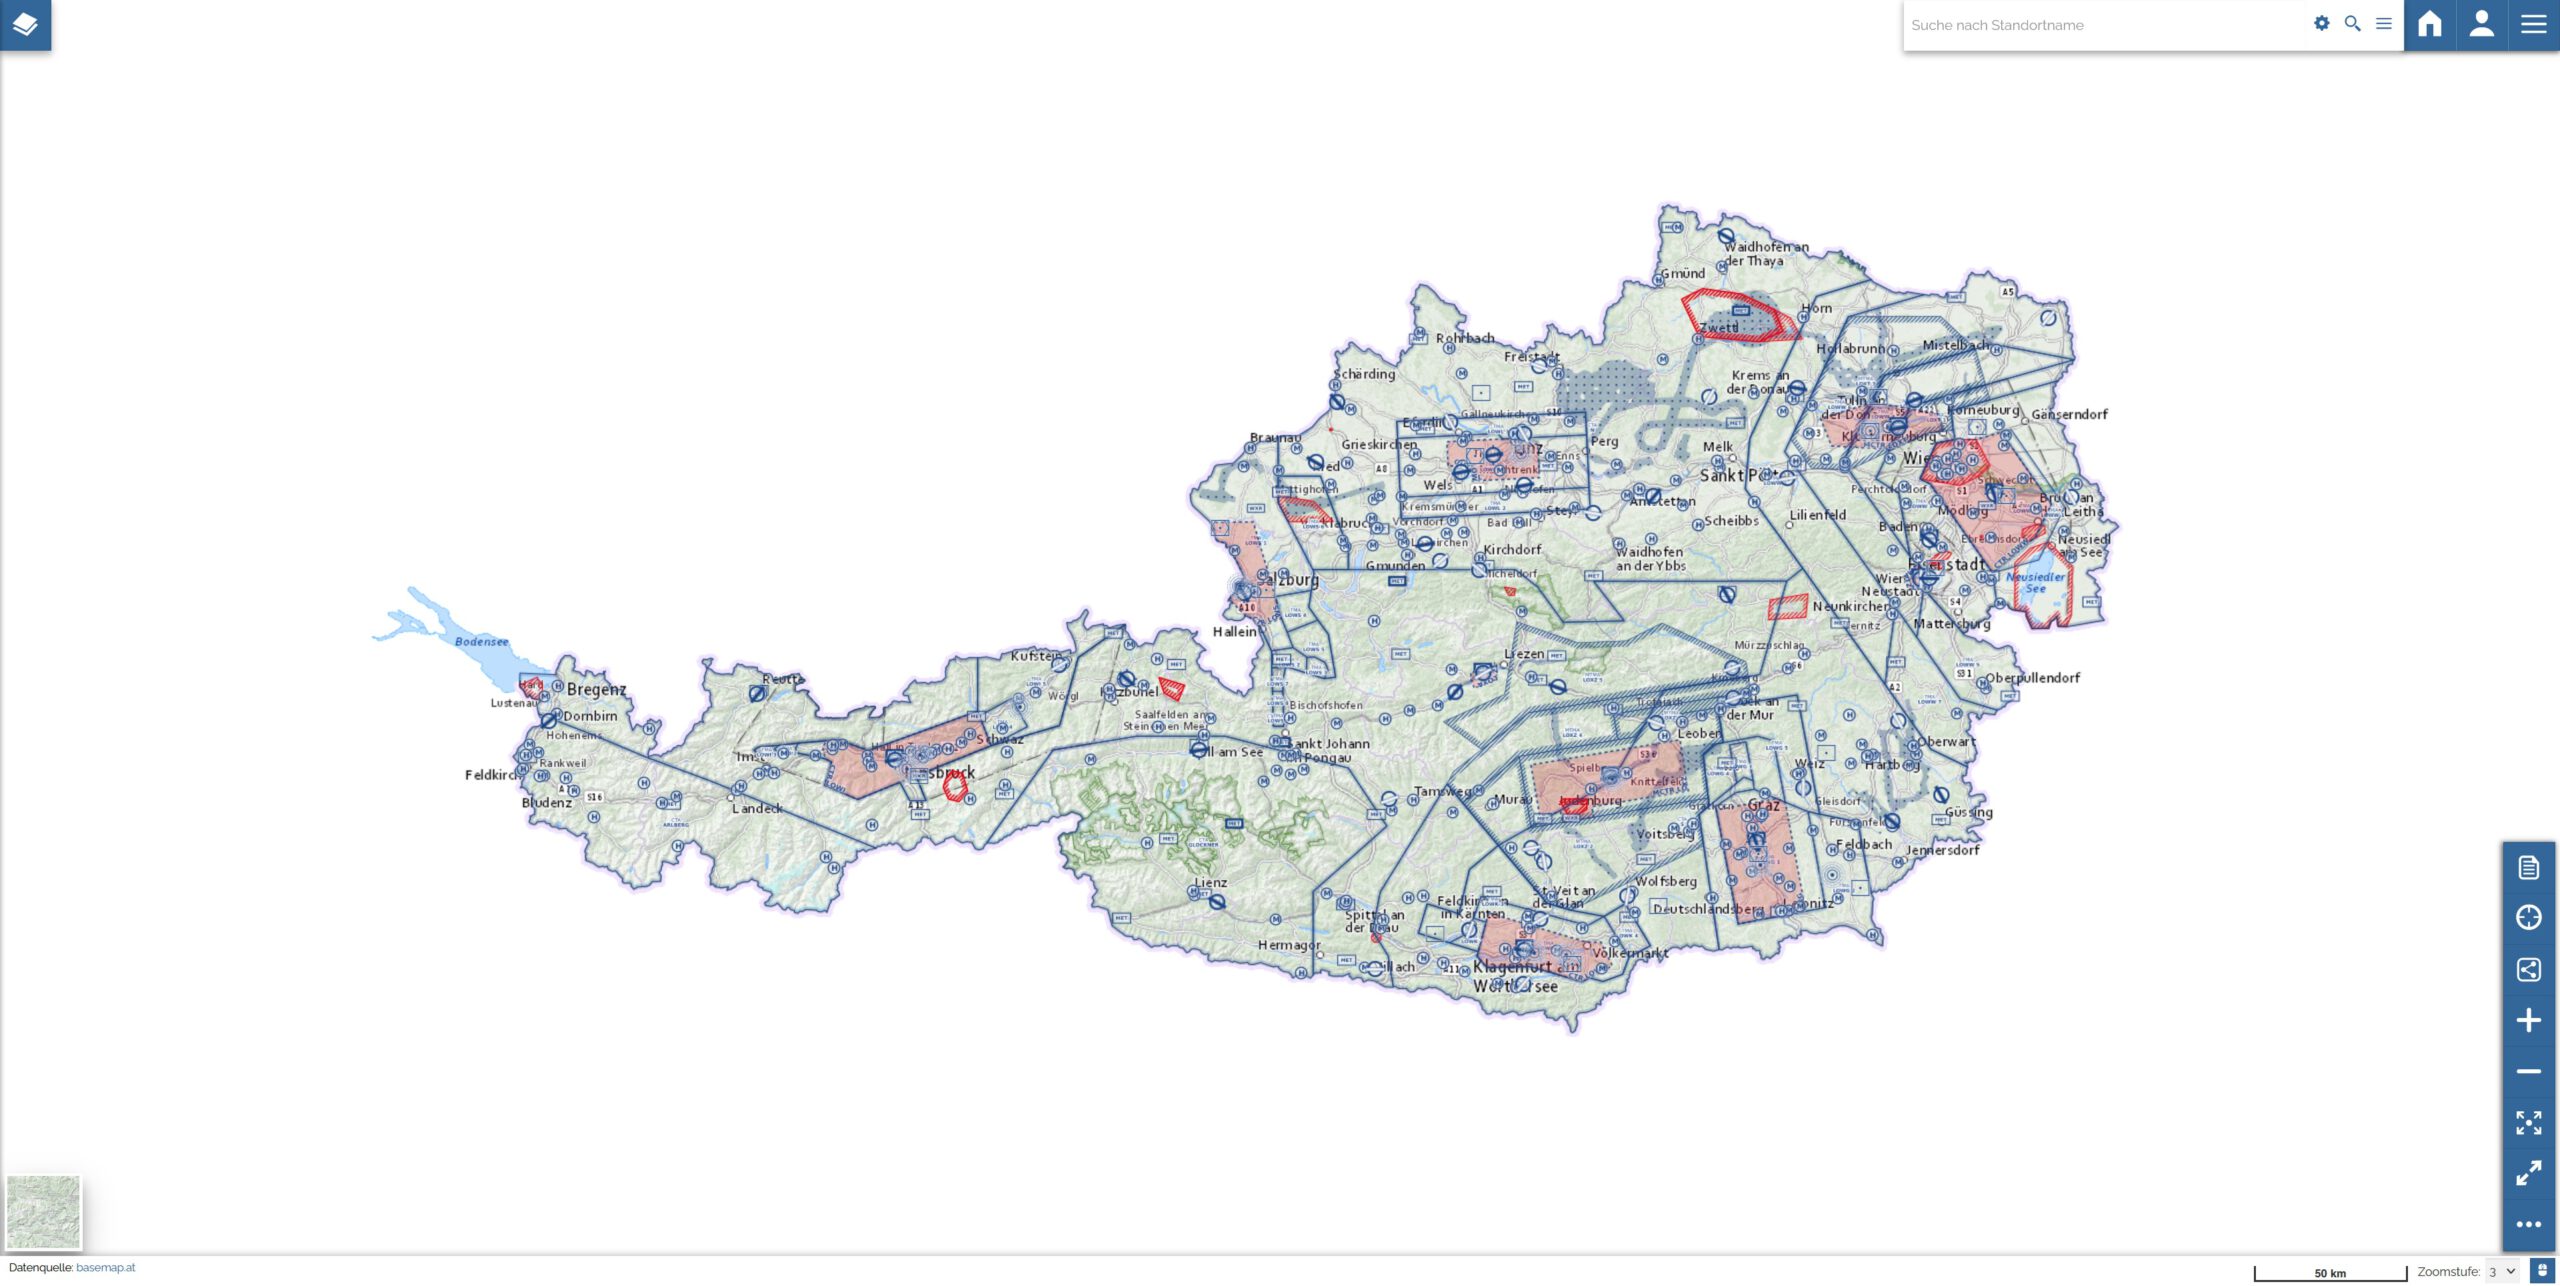
AustroControl offers an interactive, free online map. However, the help is very simple, so in this article I try to give a short introduction with the most important information for us paragliders.
The online chart VFR Austria is available here, click Continue to the application and Online Chart VFR Austria to access the chart. A very short online help can be accessed here.
Starting from the section Background Maps below, all controls arranged around the chart are explained.
Restrictions
This contribution is subject to the following restrictions:
This article is only intended to explain in general terms the functions offered by the online map. Every pilot is of course obliged to carry out a briefing on his own responsibility before every flight, in accordance with the applicable laws.
The evaluation below of the functions and data, whether useful or not for us paraglider pilots, provided in the interactive online map is my personal assessment. An experienced or less experienced pilot might come to a different assessment
AustroControl itself writes in its disclaimer:
The use of the online chart shown here is an additional service by Austro Control and does not relieve pilots from their obligation of pre-flight planning. In particular, use of the online chart does not relieve the pilot from the responsibility to observe the current edition of the AIP Austria, AIP Supplements, NOTAM and AICs. It shall be used for informational purposes only in addition to the official aeronautical publications.
The online chart shown here was created carefully and to the best of our knowledge. However, Austro Control assumes no liability for the pervious, current or future correctness and completeness for those data depicted this online chart, that are not published in the AIP Austria or in the form of AIP Supplements.
Terms
The following is only an explanation of the terms used in this article.
AIP: Aeronautical Information Publication
AustroControl: Austrian Civil Aviation Company with limited liability
DME: Distance Measuring Equipment
FIR: Flight Information Region
ft: Unit of length 1 ft = 30,48 cm (12 inch)
GAFOR: General Aviation Forecast
GeoJSON: GeoJSON is an open format to represent geographic data according to the Simple Feature Access Specification
ICAO: International Civil Aviation Organization, Publisher of the ICAO chart
IFR: Instrument Flight Rules
JSON: The JavaScript Object Notation is a compact data format in an easy-to-read text form for the exchange of data between applications.
LOVV: Flight information area Austria
NDB: Non-Directional Beacon
OGC: Open Geospatial Consortium
OSM: Open Street Map
URL: Uniform Resource Locator
VFR: Visual Flight Rules
VOR: VHF omnidirectional range
Background maps
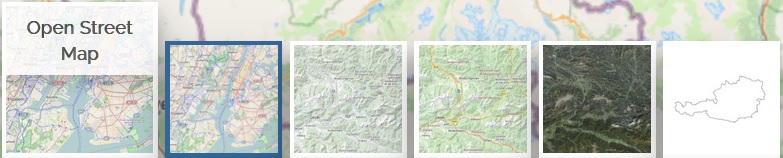
The following background maps can be selected at the bottom left.
Basemap.at Grey
Basemap are the so-called administrative base maps of Austria. They are displayed in grey with contour lines, which is of course advantageous for creating a flight plan and getting an impression of the topology of the planned route. The map and all other following maps, except the OpenStreetMap, are limited to Austria only.
OpenStreetMap
OpenStreetMap is the well-known map service. Here, the altitude of the mountains and their names are displayed. Since the map also extends beyond the borders of Austria, it is useful for planning cross-border flights. However, the airspaces are only displayed within the borders of Austria.
Basemap.at HIDPI
A double raster resolution of the Basemap Grey map, with shading but without contour line.
Basemap.at Orthofoto
A satellite view of Austria, less suitable for finding out about airspaces, etc.
FIR LOVV
Presentation of the flight information areas of Austria.
Options / Toolbar
In some cases, the commands that can be accessed via the main menu at the top right and the toolbar at the bottom right overlap, so a joint explanation is given here.
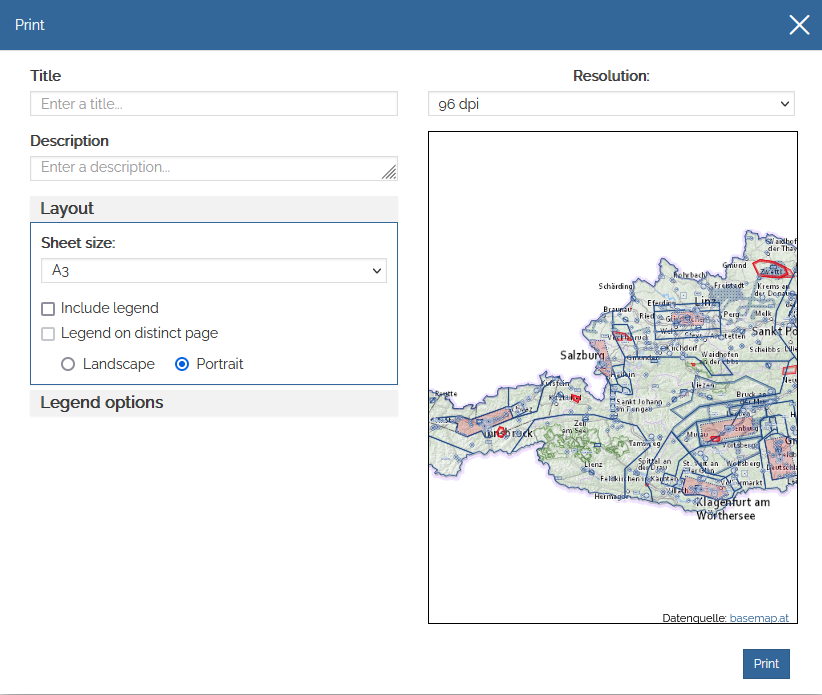
Print
Creation of a PDF of the desired map section, including legend.
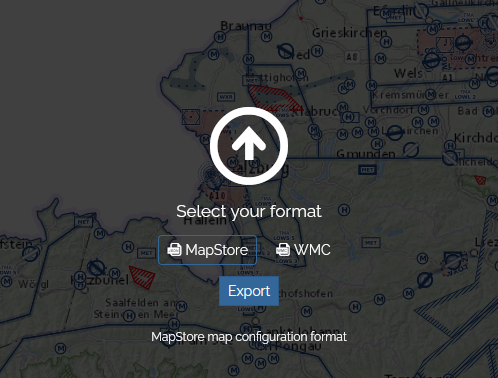
Export map
The map settings can be exported in JSON or OGC Web Map Context format.
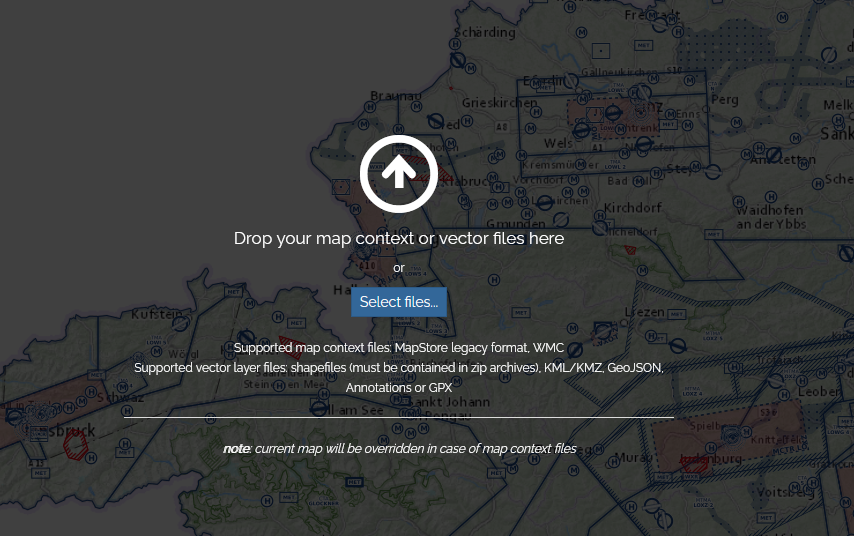
Import
Additional files in GPX and KML format as well as map settings can be imported and displayed on the map.
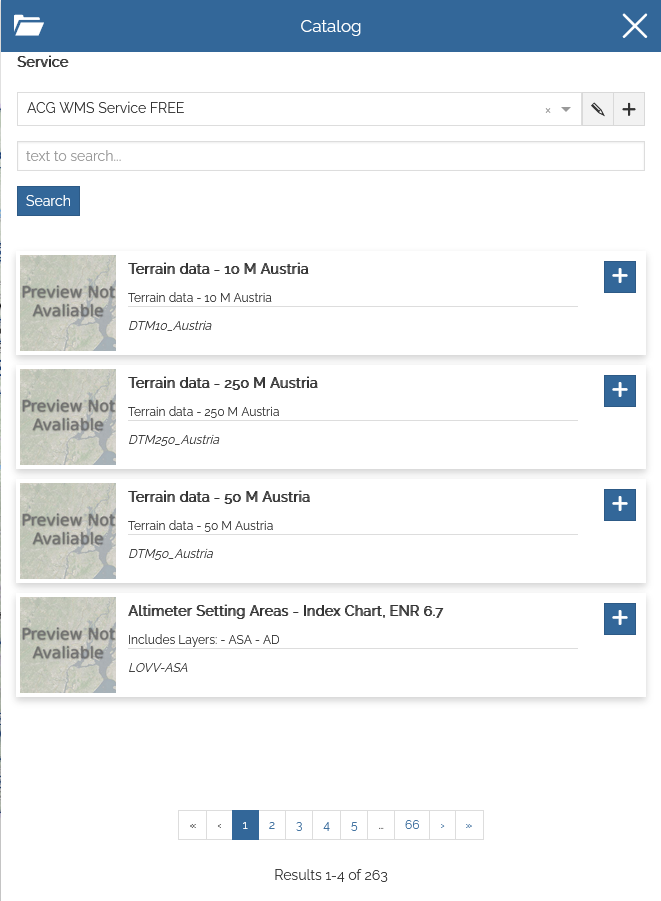
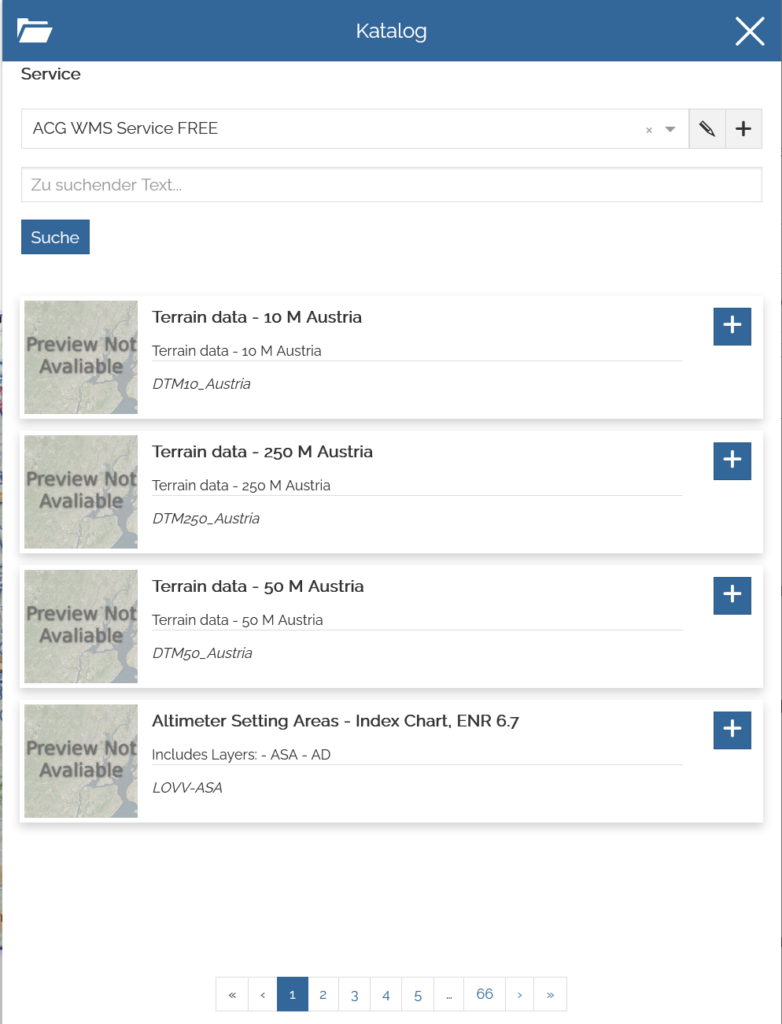
Catalogue
Maps and airspaces can be added via the menu item Catalogue. These then appear as a new layer, see menu on the left.
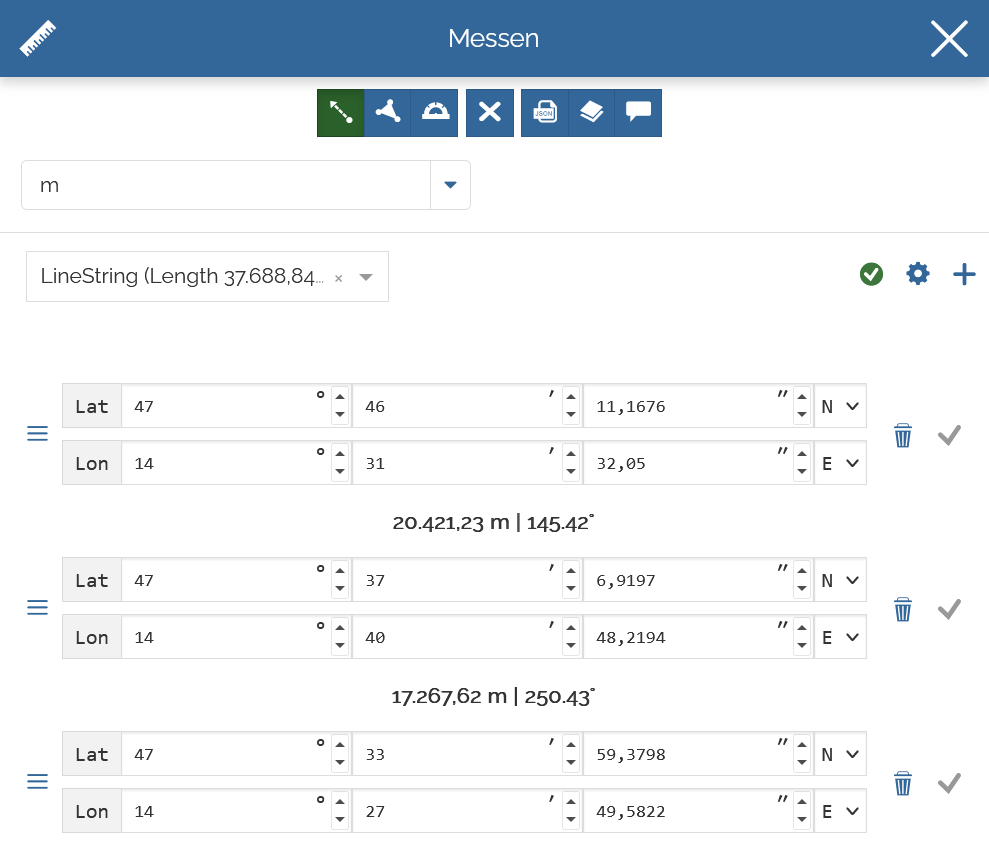
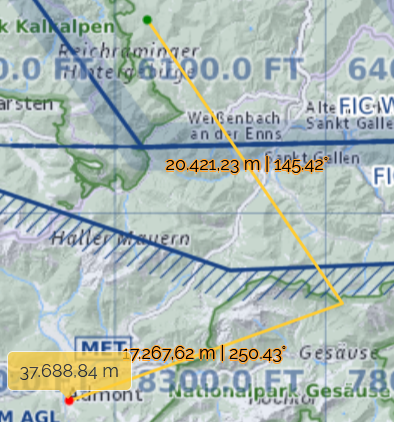
Measure, distances
Areas and directions can be measured by setting points on the map or entering coordinates (selection of measurement units possible!) and displayed in tabular form.
Other options are measuring areas (application is unclear to me) and direction. The measurements can be exported, saved as a layer or note. I will continue to measure lengths with ThermiXC, as the other functions of ThermiXC are also tailored precisely to us paragliders.
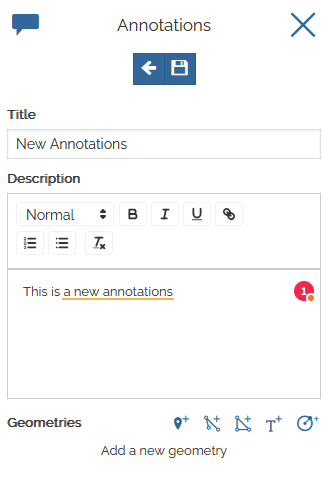
Annotations
Own geographical objects can be written, styled, saved and imported or exported as annotations.
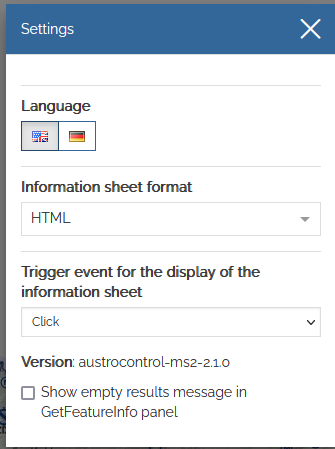
Settings
Under Settings you can set the language and the trigger event for the info box (meaning of the info box, see under Query object on the map below). The meanings for the settings Set response format and Show message with empty results are not clear to me.
Info about this map
Here again the explicit note that the chart may not be used for “operational use”. I interpret this as an indication that actual flight planning may still only be carried out with legal certainty using the official ICAO chart.
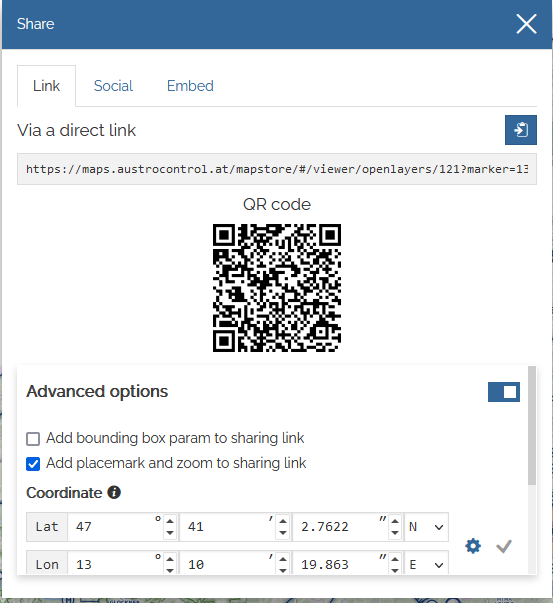
Share
The URL and QR code, as well as the social media Facebook, Twitter and LinkedIn are available for sharing the flight planning. For the IT experts, the embedded code and API can be copied.
Instructions
A short help of all menus that appear as a tooltip when hovering over the menu items.
About
Information about MapStore, a framework that serves as the basis for map display and functions.
Show my position
Locating your own position. If you are sitting at the PC, the position is determined via the IP address.
Increase zoom
Zoom in on the map step by step.
Decrease zoom
Zoom out of the map step by step.
Switch to full screen
Full-screen display of the map.
Go back
Gehe eine Ansicht zurück.
Gehe forward
Go back one view.
Zoom to maximum extension
Zoom to maximum extent of the online map of Austria when the browser is in full screen mode.
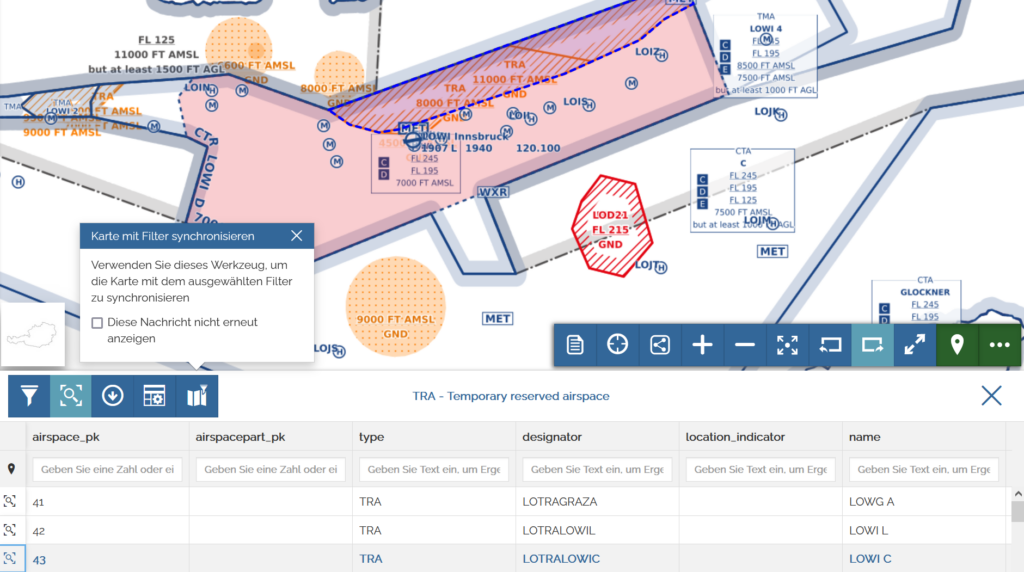
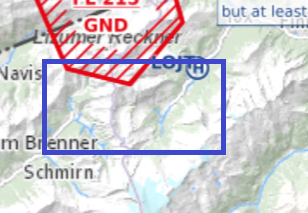
Query object on the map
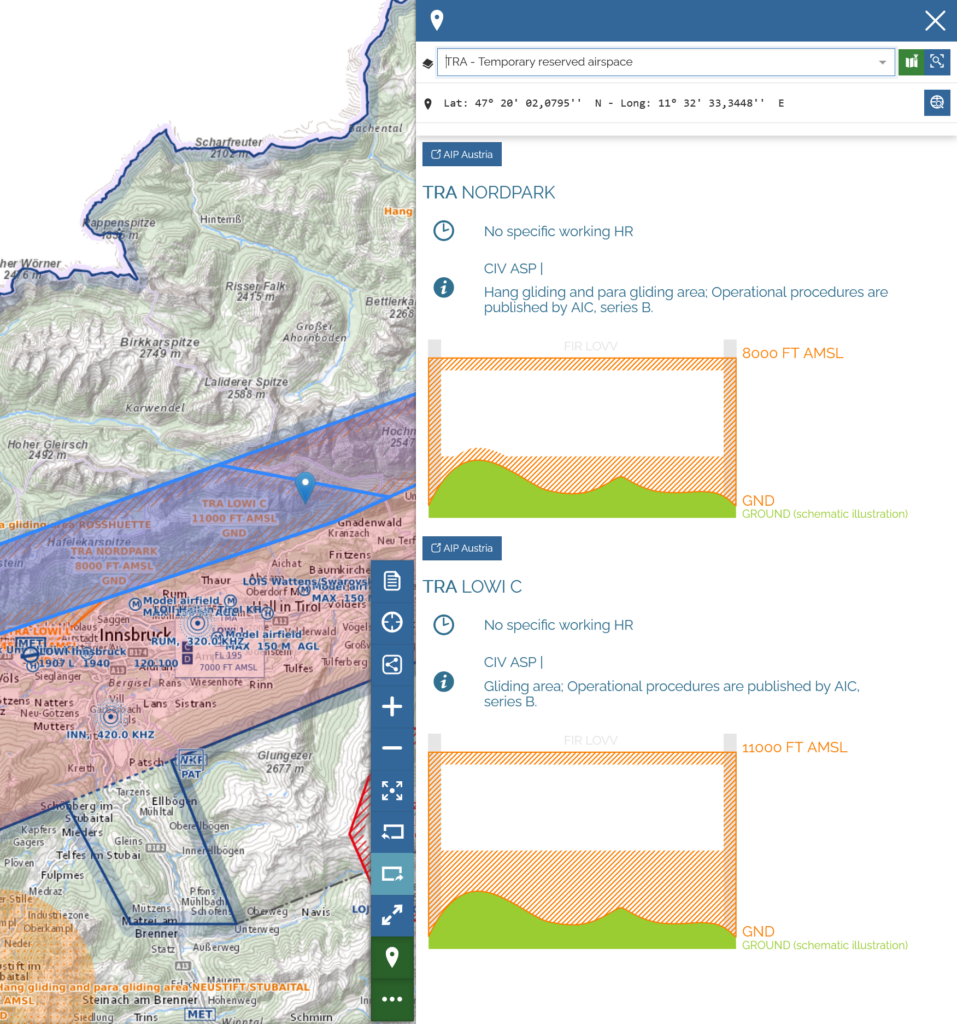
Probably the most powerful tool the interactive online map has to offer and therefore deserves this name. To find out details about the airspace structure for a specific point on the map, click on any point on the map after selecting the flag symbol. A dialogue with detailed information on the airspace structure opens on the right-hand side. Attention, the desired airspaces (see layers below) must be visible in order to be displayed in the dialogue.
At the top of the drop-down list you can select different areas of airspace that are available for the selected point. In this case, north of Innsbruck Airport, these are: CTR – Control zone, TMA – Terminal control area, TRA – Temporary reserved airspace and FIR – Flight information region. Below this, the coordinates of the selected point are displayed and a link to AIP Austria is provided. Unfortunately, the link does not work at the moment.
This is followed by detailed information and a graphic representation of the airspace area selected above. If you are unsure about reading the ICAO chart, you will be helped here. But I believe that pilots who use the ICAO chart also find it easier to use this display, as it is easy to overlook something in a complicated airspace structure. It is helpful to activate the symbol Highlight object in map, so that the areas selected in the drop-down list are highlighted in the map at the same time.
Among other things, the identification of the airspaces, operating hours, description of the airspaces and the upper and lower limits of the respective airspaces are displayed graphically.
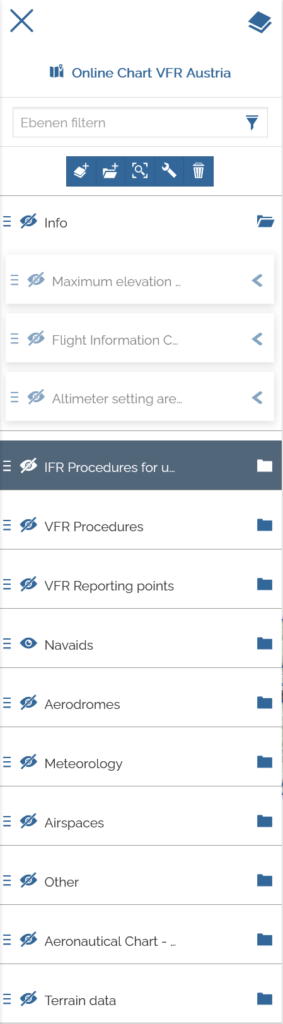
Layer
In this menu, layers can be visualised, groups deleted and created, among other things.
Move groups
The hierarchy and the order of the group can be changed by means of “drag-and-drop”.
Toggle group visibility
By clicking on the eye symbol, all layers together that are subordinate to the group can be shown or hidden in the map. Please note that if the subordinate layers are switched on or off individually, this will not be shown in the superordinate group or you will only see that certain layers are switched on or off when the group is open.
Open group
By clicking on the folder symbol, the layers belonging to the respective group can be shown or hidden.
The toolbar appears when a main group is selected.
Add layer to selected group
There are 261 maps or airspaces that can be added to the selected group.
Add subgroup to selected group
You can add your own subgroups to create a hierarchy in which maps and airspaces are arranged according to your own taste.
Zoom in on the selected layers
Zoom in on the selected layers of this group.
Settings for selected group
Nothing can be adjusted here.
Remove selected group
The selected group is deleted.
The tool list appears when a subgroup is selected. In the following, only the buttons that differ in their functionality compared to the main group are explained.
Settings for the selected layer
Format, opacity %, transport etc. can be set. I don’t think it makes sense to change any settings.
Filter selected layers
As we paragliders will use very few of the layers on offer, I don’t see any application for us.
Open attribute table
Information in tabular form about the previously selected layer, in this case the TRA layer was previously selected. Using the toolbar that appears, the data can be filtered, data can be downloaded, individual columns can be shown or hidden and the map can be synchronised. Clicking on the magnifying glass symbol in front of each line jumps to the corresponding airspace and highlights it.
Export data
Export the data of the selected layer. Among others, the formats GeoJSON and KML are available.
Groups with the subordinate layers are available, which have the following meaning:
Group Info
Layer Maximum elevation figures
Maximum Elevations – The maximum elevations indicate the highest elevation (terrain plus 328 ft or obstruction) above mean sea level in each square. An additional safety margin of 164 ft is added to this value. Of little significance to us paragliders.
Layer Flight Information Centre
Flight information centre, of little importance to us paragliders as we do not usually fly with aeronautical radio.
Layer Altimeter Setting area
The tooltip says Altimeter Setting area, I don’t really understand that, maybe it’s the wrong name. Information from the major airports such as ATIS and FIC flight frequencies and telephone numbers are displayed.
Group IFR Procedures for uncontrolled aerodromes
IFR approach procedure for uncontrolled aerodromes. This is important because you can expect increased airfield traffic and should therefore fly as far as possible around these areas. If it is unavoidable to have to fly in the vicinity, the prescribed vertical cloud clearances should be observed.
Group VFR Procedures
VFR approach procedure for uncontrolled aerodromes. This is significant in that increased aerodrome traffic is to be expected, and therefore these areas should be flown around as far as possible.
Group VFR Reporting points
Reporting points for flying under VFR. For meaning see VFR Procedures.
Group Navaids
Navigation aids such as DME, VOR and NDB. Usually of no significance to us paragliders, as we are rather rarely equipped with the appropriate devices to make use of the navigation aids.
Group Aerodromes
Displays airports and airfields.
Group Meteorology
Displays meteorological obstacles (weather stations) and GAFOR areas. GAFOR is unlikely to be used by a paraglider pilot, therefore less interesting.
Group Airspaces
All airspaces that are of interest for VFR flying are available here. The airspaces that are to be displayed under Query object on map must be switched on here.
Group Other
Layer National parks – Austria
Austrian National Parks accordingly: https://www.nationalparksaustria.at/. Please note that flight restrictions in national parks are regulated by the provincial governments. For more information click on the respective national park on the map or visit https://eaip.austrocontrol.at. AIP Austria GEN1.6 chapter 2.5.
Group Isogonic line
For the determination of the location misdirection for navigation with a magnetic compass, therefore not relevant for us.
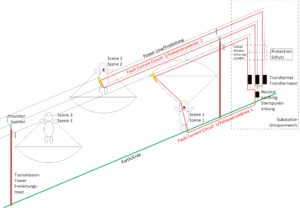
Group Obstacles ENR
Fade in aeronautical obstacles such as cable and material lifts, antennas, etc.
Group Aeronautical Chart – ICAO 1:500000
Aeronautical Chart – ICAO 1:500000 Austria. This map contains information corresponding to the requirements of visual aviation for low speed, short or medium range operations at low and medium altitudes. The map corresponds to the ICAO map, which is also available for purchase in paper or for download from AstroControl.
Group Terrain data
Display a topological map, I can’t see any use.
Miscellaneous
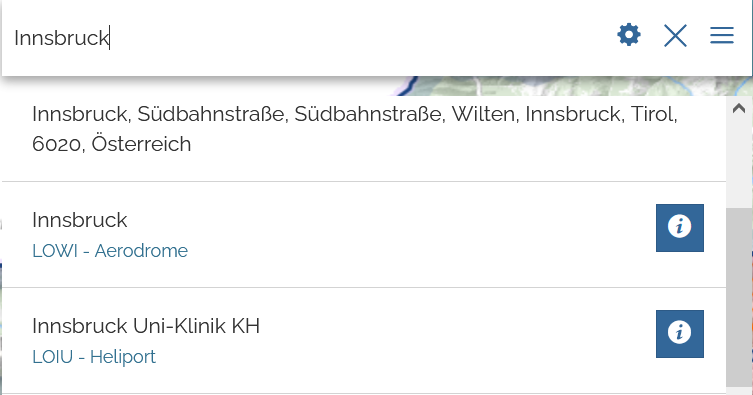
Search bar
Search for aeronautical data or postal addresses. Geographical coordinates can also be entered (you can choose between decimal and aeronautical format). I see little use for paraglider pilots here.
Zoom function
Zoom to the desired map section by pressing the Shift key and simultaneously dragging a rectangle with the left mouse button.
Conclusion
With this online map, AustroControl offers us a comprehensive and powerful tool with many possibilities, even if some things still seem experimental to me. But as the saying goes, you don’t look a gift horse in the mouth. Therefore, I will certainly use the online map more often, especially since the ICAO map is really hard to read with a complicated airspace structure. Furthermore, you can definitely use the map to learn how to read the ICAO map by comparing the online map with the ICAO map. An exercise could be to first try to understand the airspace structure of the ICAO chart and then cross-check the result with the online chart. This is a benefit for other countries that do not provide an online map.
Perhaps someone from AustroControl will read this contribution, I have a few suggestions for improvement:
Use consistent terms (e.g. we talk about layers and levels).
Comprehensive online help
Elimination of bugs
Creation of a user profile. Exporting and importing the settings seems very cumbersome to me, but I have not tested it
Responsive design to make the map usable also on smartphones and tablets
Visualisation of all airspaces at one point without having to switch areas of the airspaces (cf. section Query object on the map)
But otherwise, keep it up, AustroControl, maybe the air navigation services of other countries will learn something from you. You also make a lot of other things freely available for download.
Spot on with this write-up, I actually believe this amazing site needs much more attention. I’ll probably be returning to
read more, thanks for the info!
Hmm it seems like your blog ate my first comment (it was extremely long) so I guess I’ll just sum it up what I submitted and say, I’m thoroughly enjoying
your blog. I too am an aspiring blog blogger but I’m still new to everything.
Do you have any helpful hints for novice blog writers?
I’d genuinely appreciate it.
Sorry, I checked the spam folder, but I couldn’t find your comment. I can’t give you a special hints, as I am also new in this business. I just keep my blog a simple as possible. Maybe check out others blogs, how they’re writing and the design of the webpage. What will be the topic of your blog?
This website uses cookies to improve your experience. We'll assume you're ok with this, but you can opt-out if you wish. Cookie settingsACCEPT
Privacy & Cookies Policy
Privacy Overview
This website uses cookies to improve your experience while you navigate through the website. Out of these cookies, the cookies that are categorized as necessary are stored on your browser as they are essential for the working of basic functionalities of the website. We also use third-party cookies that help us analyze and understand how you use this website. These cookies will be stored in your browser only with your consent. You also have the option to opt-out of these cookies. But opting out of some of these cookies may have an effect on your browsing experience.
Analytical cookies are used to understand how visitors interact with the website. These cookies help provide information on metrics the number of visitors, bounce rate, traffic source, etc.
Functional cookies help to perform certain functionalities like sharing the content of the website on social media platforms, collect feedbacks, and other third-party features.
Necessary cookies are absolutely essential for the website to function properly. This category only includes cookies that ensures basic functionalities and security features of the website. These cookies do not store any personal information.
Performance cookies are used to understand and analyze the key performance indexes of the website which helps in delivering a better user experience for the visitors.
Werbe-Cookies werden verwendet, um Besuchern relevante Werbung und Marketing-Kampagnen anzubieten. Diese Cookies verfolgen Besucher auf verschiedenen Websites und sammeln Informationen, um maßgeschneiderte Werbung zu liefern.


Spot on with this write-up, I actually believe this amazing site needs much more attention. I’ll probably be returning to
read more, thanks for the info!
Hmm it seems like your blog ate my first comment (it was extremely long) so I guess I’ll just sum it up what I submitted and say, I’m thoroughly enjoying
your blog. I too am an aspiring blog blogger but I’m still new to everything.
Do you have any helpful hints for novice blog writers?
I’d genuinely appreciate it.
Sorry, I checked the spam folder, but I couldn’t find your comment. I can’t give you a special hints, as I am also new in this business. I just keep my blog a simple as possible. Maybe check out others blogs, how they’re writing and the design of the webpage. What will be the topic of your blog?