Jörg Korner poses this somewhat provocative question on his blog. For paraglider manufacturers, this is a controversial issue, as marketing has, until now, consistently promised an improved glide ratio (and thus reduced sink rate) alongside increased safety with every new generation of paraglider. Jörg questions at least the claim of reduced sink rate, but what then becomes of the motivation for pilots to always buy the latest generation of paragliders?
Jörg’s original post can be viewed here. This statement is based on a study he carried out (referred to as the ‘Paper’ in the post and available for download there), in which he comprehensively analyses the igc files uploaded to XContest (see the section on Jörg’s study below for a summary). The flights took place in Valais, Switzerland. He presumably carried out the study to identify the thermally active areas within the region under investigation.
Research findings
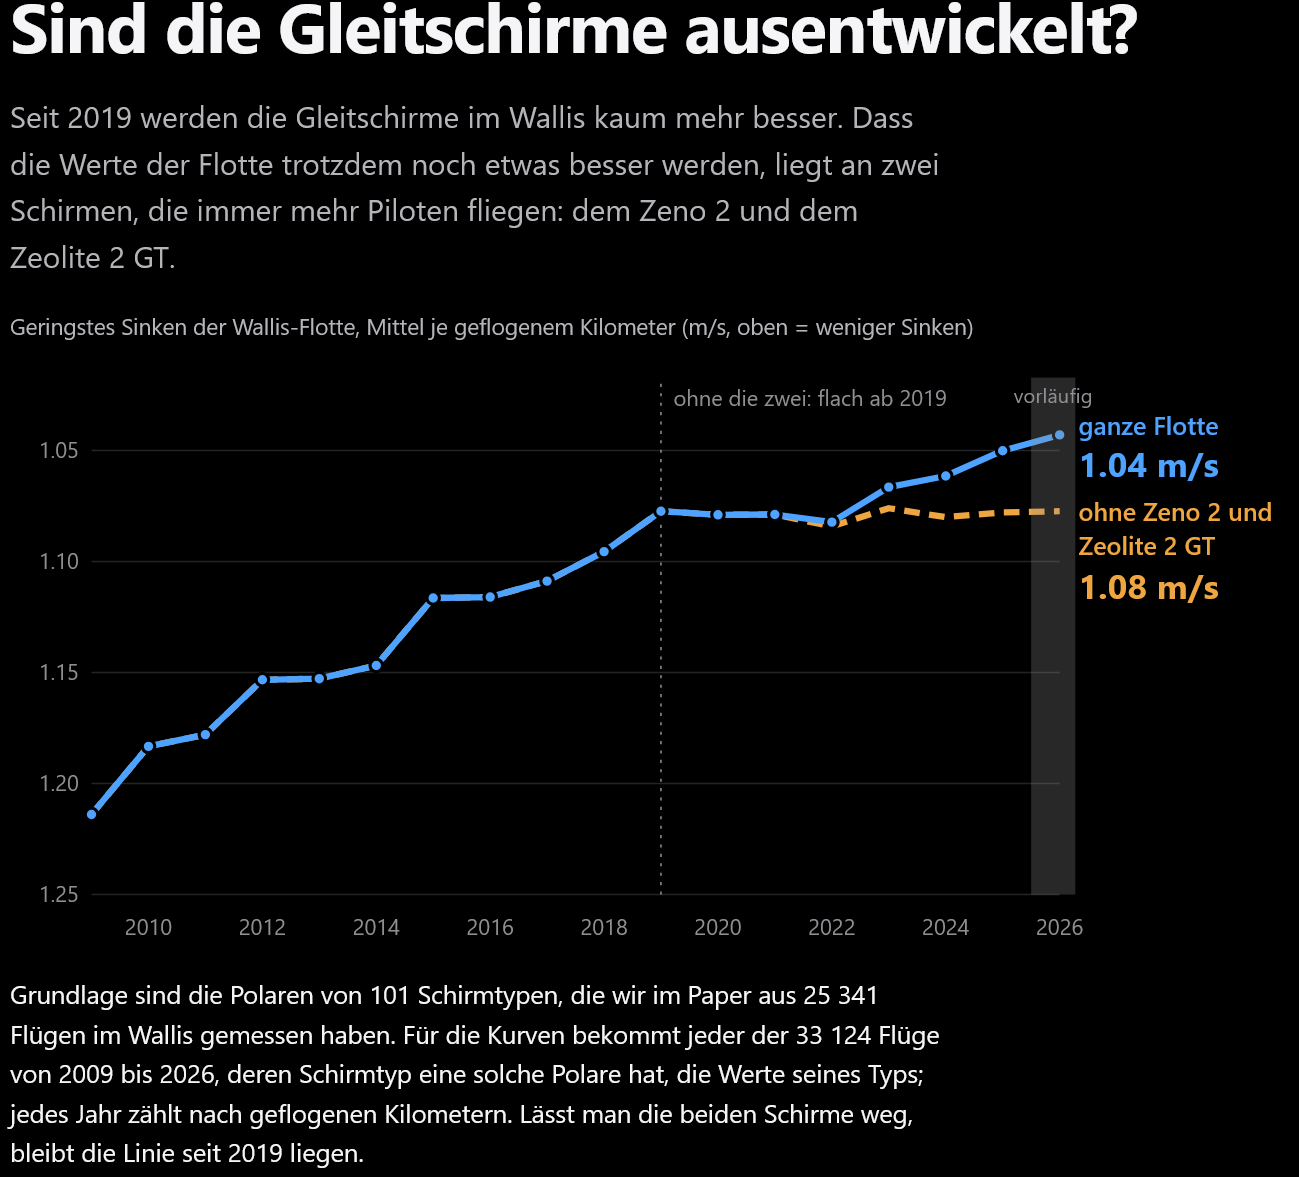
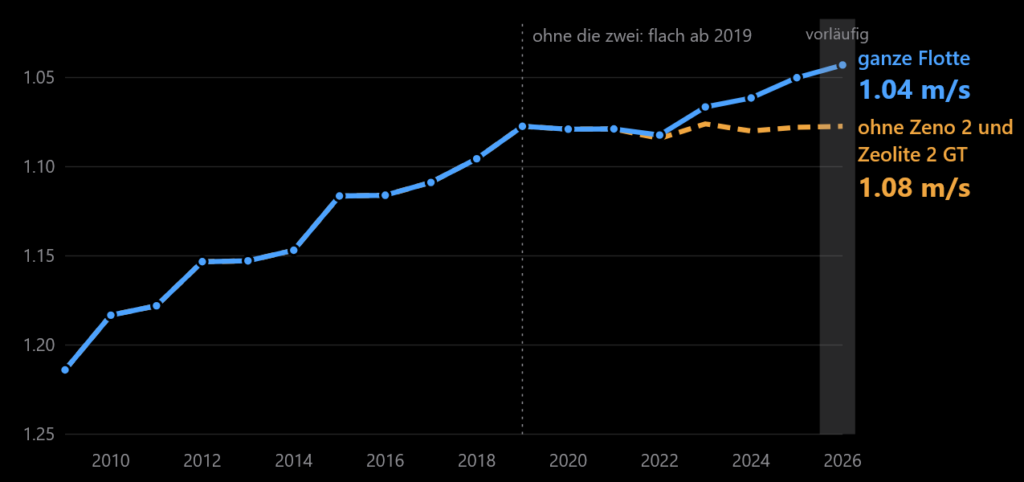
The results of his study show that, since 2019, the majority of paragliders have not shown any improvement in their sink rates. The lowest sink rate has fallen from 1.21 to 1.08 m/s, whilst the glide ratio has risen from 8.6 to 9.7. Jörg attributes the increase since 2019 to the fact that pilots have switched to the Zeno 2 and Zeolite 2 GT models since then. The yellow dotted line shows the trend when this effect is factored out.
Jörg does not see his research as proof that the performance of the paragliders has stopped improving, but there are unlikely to be any major leaps forward in their development from now on.
Pilot’s opinion
I started a poll in the club’s messaging group asking, ‘Do you think that, on the whole, the development of paragliders has already reached its peak?’. 50 per cent of pilots actually believe that the peak has already been passed, whilst 50 per cent think that the development of paraglider performance is set to continue.
I answered ‘no idea’ in the survey. Reason: In the past, products have been able to achieve a surge in innovation through new materials. A lot of performance is lost due to ballooning. Perhaps new materials or a different design (perhaps with the help of AI) could offer a way to reduce this ballooning effect. I therefore believe that further developments remain to be seen. But that’s just speculation on my part.
Manufacturer
Jörg’s realisation is actually bad news for paraglider manufacturers looking to sell new paragliders. However, it could provide an incentive to rethink marketing messages. Instead of advertising performance, safety could play a central role. I get the feeling that safety is, in any case, an important criterion for an increasing number of pilots – or perhaps always has been.
I can think of the following reasons why pilots will continue to buy new paragliders at regular intervals:
- Safety, e.g. further development of reflective profiles.
- End of service life reached. With fabrics becoming ever lighter and lines becoming fewer and thinner, it is only natural that the service life of paragliders is decreasing.
- The desire among some pilots to always have the very latest paraglider, even if the improvement in performance is marginal.
- Pilots continue to develop their skills, so moving up to a higher class is the logical next step. However, pilots also move down from a higher class to a lower one for a variety of reasons.
- Following the trend towards wanting ever lighter kit. Weight plays an important role, even for pilots who take the mountain railway to the launch site.
- Switching to a different discipline within our sport, e.g. acro flying.
I think manufacturers will continue to generate sales in the future. Whatever the reasons, sales of paragliders are likely to remain high. Unlike in other air sports, we rarely fly in a glider that is more than six years old.
Jörg’s study
I had ChatGPT summarise Jörg’s study “Separating the glider from the air: paraglider sink polars and the flow field of an Alpine valley from 86,000 flight logs”, to which he refers in his post, to make it easier to understand. I have edited the summary slightly. I haven’t checked whether it is correct, but it seems plausible to me. To ensure a clear link to the original paper, the headings and numbering are largely identical.
Abstract
A variometer measures both the vertical movement of the air and the paraglider’s own rate of descent. To determine whether the air is rising or sinking, it is therefore necessary to know how fast the paraglider itself is descending.
This study uses data from 25,341 flights to estimate descent curves for 101 types of paraglider. To this end, 86,190 flight logs from the Swiss canton of Valais, recorded between 2007 and 2026, were analysed. Using these curves, the researchers estimate air movement along some 2.3 million gliding flight segments and use this data to create a long-term map of vertical air movements.
The results reveal recurring patterns: the air often rises over sun-drenched slopes and ridges, whilst it sinks in parts of the valleys. The study also highlights differences in paragliding performance and demonstrates that flying technique can have a significant influence on the measured climb rates.
1 Introduction
Paragliders can be used to observe rising and sinking air. However, their flight instruments do not measure air movement directly. A variometer measures the combined effect of vertical air movement and the paraglider’s own rate of descent.
Previous studies have used flight data from paragliders to investigate thermals and flight behaviour. However, in order to isolate the paraglider’s performance from the surrounding air movements, its sink rate must be known. This describes how quickly the paraglider sinks at different airspeeds.
This work has two main objectives:
- To develop a method for determining descent curves for numerous types of paragliders from standard flight records.
- To use these sink polar diagrams to map the typical vertical air movement in Valais.
The resulting flow map describes long-term patterns rather than conditions on a particular day.
2 Data
2.1 Flight records and segmentation
The study uses flight logs uploaded to the XContest online platform for cross-country flights. Of the 86,369 logs submitted from Valais, 86,190 were successfully imported. The logs generally contain data on position and altitude recorded at one-second intervals. Software identifies sections of circling and straight-line flight, estimates the wind based on the movement of circling paragliders, and calculates the airspeed relative to the air. The straight-line flight sections are particularly important because they make it possible to analyse the paraglider’s sink rate separately from its climb in the thermals.
2.2 Thermal strength for the day
The researchers estimate the strength of the thermals on a given flying day based on the climb rates of pilots who circle and glide for a sufficiently long time. They use the median of the climb rates from suitable flights as a measure of the daily thermal strength. This enables them to distinguish between days with weak and strong thermals and to take into account the fact that the air tends to sink between thermals.
2.3 Types of paragliders
The names of the paragliders in the flight records are entered by the pilots. They often contain variations in spelling, size specifications and other discrepancies. The researchers standardise these names in order to reliably identify individual models. Using manufacturers’ specifications and test reports, they classify the paragliders into the certification classes EN A to EN D and the competition class CCC. For a total of 101 paraglider types, sufficient suitable data was available to estimate a sink polar.
3 Method: Sink Polars
3.1 One equation per second
During level flight, the measured vertical velocity consists of two components:
- The vertical velocity of the surrounding air.
- The paraglider’s own rate of descent at the current airspeed.
Air movement changes from one moment to the next. By contrast, the paraglider’s rate of descent at a given airspeed remains approximately constant under comparable conditions. By analysing many seconds of flight at a similar airspeed, the researchers can statistically estimate the paraglider’s rate of descent.
3.2 Air density
As altitude increases, the air becomes thinner. This affects both the airspeed and the sink rate of a paraglider. The researchers therefore correct the data to a reference altitude of 2,000 metres. Between 1,000 and 3,000 metres, the correction for air density can alter the estimated sink rate by around 10 per cent.
3.3 How pilots choose their speed
Pilots do not choose their airspeed at random. They often fly more slowly in rising air, whilst they tend to fly faster in sinking air or when leaving a thermal. This presents a problem: the air encountered at a particular speed may not be representative of typical gliding conditions. The researchers assume that the speeds most frequently chosen by pilots tend to reflect typical flying conditions. For each paraglider class, they determine the speed range within which this assumption is considered sufficiently reliable, and avoid adjusting the sink polars outside this range.
3.4 The most common measured value
For each type of paraglider and each flying speed, the researchers are analysing the distribution of the recorded vertical speeds. They use the most frequently occurring value instead of the mean. The reason for this is that the mean value can be skewed by individual phases with strong updrafts. The most frequent value is less affected by such exceptional conditions and therefore provides a better estimate of the paraglider’s typical sink rate.
3.5 The air between the thermals sinks
Rising air in thermals must be balanced by falling air elsewhere. Consequently, the air through which paragliders glide between thermals is not necessarily still. The researchers have found that the most frequently observed vertical speed during gliding flight systematically varies with the strength of the thermals on any given day. They estimate this relationship and correct the data to account for the average downward movement of air between the thermals. This makes it easier to isolate the paraglider’s own rate of descent.
3.6 The physical curve
The descent polar is adjusted using a physical model based on aerodynamic drag. In simple terms, the model takes two effects into account:
- The drag exerted by the paraglider, the pilot and the equipment, which becomes increasingly significant at higher speeds.
- The drag associated with the generation of lift, which becomes more significant at lower speeds.
The resulting curve illustrates the relationship between airspeed and rate of descent. The researchers fit the curve only within the speed range supported by the data. Values outside this range are not treated as equally reliable measurements.
3.7 Uncertainty
The researchers estimate the uncertainty by repeatedly reselecting the flight data and recalculating the curves. At 40 km/h, the typical 95 per cent uncertainty interval for the estimated sink rate is approximately ±0.03 m/s. This shows that the method can estimate sink rates with reasonable accuracy. However, the reliability of the results depends on the specific type of paraglider and the amount of data available.
3.8 What ‘rate of descent in still air’ means
The researchers adjust the data to account for the fact that the air between the thermals tends to sink. They then estimate how quickly the paraglider would sink if the surrounding air were not moving vertically.
This results in a standardised sink rate, which can be used to compare the performance of different paragliders. It is a statistical estimate based on observed flights and the corrections made, not a direct measurement taken in completely still air.
4 Results: Sink Polars
The estimated descent polars enable researchers to compare different types of paragliders and to investigate whether their performance changes with different equipment configurations.
4.1 Sink rates for paraglider classes
At 35 km/h and a reference altitude of 2,000 metres, the following average values are obtained:
| Paragliding class | Sink rate | Slip ratio |
|---|---|---|
| EN A | 1.26 m/s | 8.2:1 |
| EN B | 1.15 m/s | 9.2:1 |
| EN C | 1.09 m/s | 9.5:1 |
| EN D | 1.02 m/s | 10.3:1 |
| Competition | 0.93 m/s | 11.2:1 |
Higher performance classes generally have lower sink rates and better glide ratios. A glide ratio of 10:1 means that a paraglider travels approximately ten metres horizontally whilst losing one metre in altitude. These figures are averages for the models tested and do not constitute guaranteed performance data for every paraglider or pilot.
4.2 Outside the measurement range
Outside the speed ranges used to fit the sink rate polars, the observed vertical speeds deviate from the predictions of the fitted curves. At higher speeds, paragliders appear to sink less than the curves would suggest. This effect is particularly noticeable in the first minute after a thermal, when the surrounding air may still be rising. However, pilots also tend to fly faster in sinking air. The researchers cannot therefore assume that all observed differences are caused by the paraglider itself. For this reason, the sink polars are only adjusted within the speed ranges classified as reliable.
4.3 The harness effect
The researchers are investigating the Ozone Enzo 3 competition paraglider before and after the introduction of a streamlined competition harness. The estimated sink rate improves by approximately 0.03 m/s at 35 km/h and by 0.07 m/s at 45 km/h. At 45 km/h, the derived glide ratio increases from approximately 10.9:1 to 11.6:1. The increasing advantage at higher speeds is consistent with the assumption that a streamlined harness reduces aerodynamic drag. However, the data do not prove that the harness alone caused the change. Other changes to the equipment, the glider or the pilot’s weight cannot be completely ruled out.
5 The flow field of the Valais
The researchers use the sink polars to estimate vertical air movement along straight gliding sections. By combining these measurements, they produce a long-term map of rising and sinking air in Valais. The map depicts average conditions over many days of flying and a period of approximately two decades. It describes air movement along the flight routes chosen by pilots, not the average vertical movement of the entire atmosphere or the conditions on any given day.
5.1 Creating the map
For each gliding flight segment, the researchers combine the recorded change in altitude, the flight duration, the airspeed and the estimated sink rate of the respective paraglider. Once the paraglider’s own sink rate has been taken into account, they obtain an estimate of the vertical air velocity. These measurements are aggregated onto a grid with cells approximately 500 metres on a side. The calculation also takes into account altitude and the time of day. In total, the flow field comprises around 2.26 million gliding flight segments, corresponding to approximately 42,400 hours of gliding flight.
5.2 What the flow field reveals
The maps show a recurring pattern of Alpine air circulation. In the morning, the air often rises along sun-exposed slopes. In the afternoon, rising air is often found over slopes and ridges, whilst the air over the centre of the Rhône Valley and some side valleys sinks. This pattern corresponds to the way sunlight warms mountain slopes. The warmed air rises along the slopes, whilst compensating air sinks elsewhere. The map shows the air conditions pilots encounter along their chosen flight routes. As pilots specifically seek out rising air, the average shown does not correspond to the mean vertical velocity across the entire valley region.
5.3 Thermals
The flow field is based on straight gliding sections and therefore does not directly show the centres of the thermals. The researchers are therefore examining the climbing sections separately to determine where thermals occur, how strong they are and how they shift with altitude. The example of Fiesch shows that thermals frequently occur along the sun-exposed slopes north of the Rhône Valley, between Riederalp and Eggishorn, and above Bellwald. At an altitude of 2,500 metres and at around 11 am, 41 per cent of the pilots flying past the slope between Fiescheralp and Eggishorn climbed there. The median thermal strength, converted to an EN-D paraglider, was approximately 1.8 m/s at 2,500 metres and 2.1 m/s at 3,100 metres. The direction of the thermals changed as the day progressed: in the morning they drifted mainly north-north-west, whilst later in the afternoon they tended to move along the valley.
5.4 A test using years that were not used for the map
To check whether the flow field captures recurring patterns rather than merely reflecting the data from which it was created, the researchers omit one year at a time when producing the maps. They then test how well the map predicts air movement in the omitted year. The climatological map explains approximately 13 per cent of the differences between individual gliding flight segments. When the measurements are averaged over larger areas and entire days, the proportion explained rises to around 29 per cent.
These results show that the map captures significant patterns related to location and time of day. However, a large proportion of the variations continues to be caused by the weather on the day in question, small-scale thermals, turbulence and measurement uncertainties. The flow field is therefore useful for understanding typical conditions. However, it cannot predict the exact air movement on a specific day.
6 What climb rates measure
The recorded rate of climb is not determined by the air alone. It also depends on the paraglider’s rate of descent, the altitude, the bank angle whilst circling, and the pilot’s ability to hit the centre of a thermal.
The study identifies several influencing factors:
- Paraglider: Different types of paraglider have different rates of descent.
- Altitude: Thinner air increases the rate of descent.
- Bank: When circling, the paraglider descends more steeply than when flying in a straight line.
- Flight technique: Pilots differ in how effectively they maintain their position within the strongest part of a thermal.
The differences between pilots are considerable. The top quarter of pilots achieved climb rates approximately 0.35 m/s higher than the remaining pilots during comparable climb sections. For the top tenth, the difference was approximately 0.53 m/s. These differences are likely to be attributable, at least in part, to how well the pilots centre and utilise the thermals, and not solely to differences in the strength of the air encountered. Climb rates cannot therefore be interpreted as direct measurements of thermal strength without taking into account the influences of the paraglider and the pilot.
7 Discussion
The study shows that large collections of routine paraglider flight records can provide valuable information on both paraglider performance and atmospheric motion. The method makes it possible to estimate sink polars without the need for specialised flight test equipment. Once these polars are available, researchers can separate the paraglider’s sink rate from vertical air movement and produce a detailed climatological map of an Alpine valley.
Several limitations remain. The method is based on assumptions about how pilots select their airspeed. Estimates outside the speed ranges supported by the data are less reliable. Furthermore, the descent rate combinations of gliders, harnesses, pilot weights and equipment reflect real-world flying conditions rather than strictly controlled laboratory conditions.
The wind map shows long-term averages for the Valais and is not a substitute for weather forecasts. Daily weather conditions and small-scale atmospheric processes continue to account for a large proportion of the variations observed during individual flights.
Overall, the main contribution of this work lies in a practical method that enables information to be extracted from existing flight records regarding both paraglider performance and air movement in Alpine valleys. It provides a basis for comparing paragliders and investigating recurring flow patterns. At the same time, it demonstrates why observed climb rates must be interpreted with care.