
Many pilots, and not only cross-country flight experts, now use XC Track, installed on their Android smartphone, to keep themselves informed about important data during the flight. One of the great strengths of XC Track is at the same time one of the great problems, namely that XC Track is very flexibly configurable. I would like to explain my concept for XC Track and how I configured my XC Track page layout in more detail in this article.
Introduction
XC Track is now very widespread among pilots (except perhaps among iPhone fanboys). I myself have been flying with XC Track for several years in combination with the XC Tracer which is connected via Bluetooth.
Note 1: In the following I will only explain the widgets as far as it is necessary for understanding the concept, further description of the widgets can be found on the AIR3 website.
Note 2: As I took the screenshots at home using the Tracklog Replay function, the positions on the websites (e.g. Thermik Pumpt) do not match those on the XC Track maps.
Basics
At the beginning, one is more inclined to display too much data on too small a display; basically, less is often more. Since I have been using hardware buttons, I am able to display the data on several page layouts, because switching between the page layouts is possible without releasing the brakes. This makes it possible to display the correct data for the respective flight situation. How I have distributed the data to the different page layouts is explained in the following 5 chapters.
Basically, I have set all charts with north at the top, because the internet pages (e.g. of Thermik Pumpt) can only be displayed this way. It would be quite confusing to have north up on one map and bearing up on the other. However, you have to get used to it and always be aware of where the cardinal points are. On the sat nav in the car, the direction of travel is usually shown at the top, so it is quite an adjustment.
Where possible, I have tried to position the same widgets in the same place on the different page layouts. For example, the altitude GPS is placed at the bottom left on page layout 1 and 2.
Here you can download the configuration. After download, you have to unzip the file:
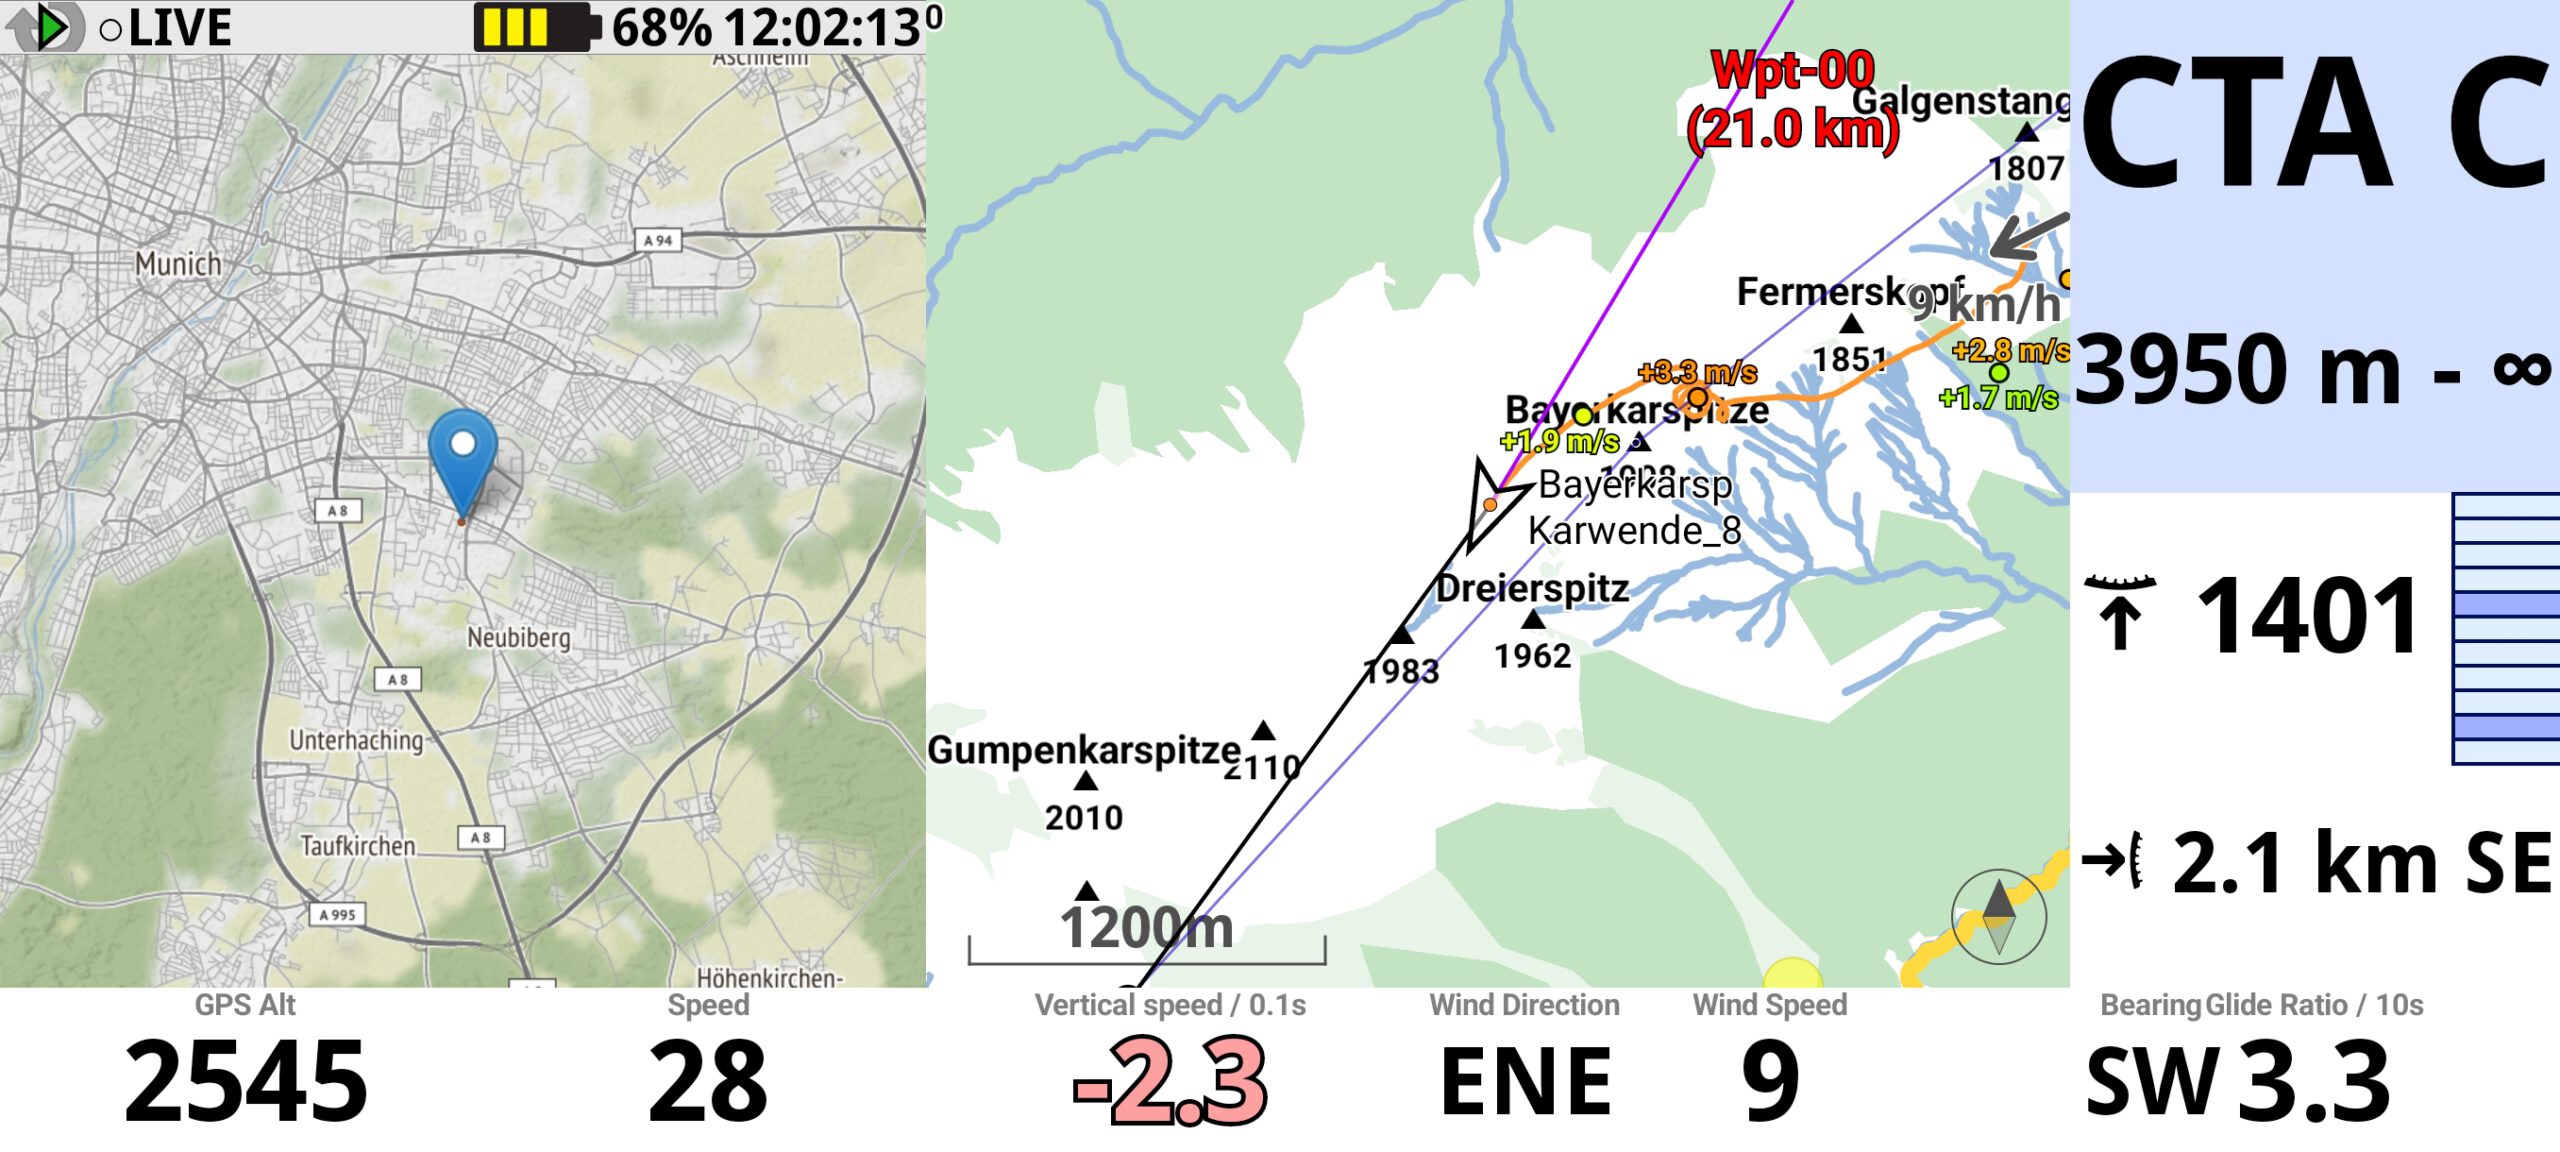
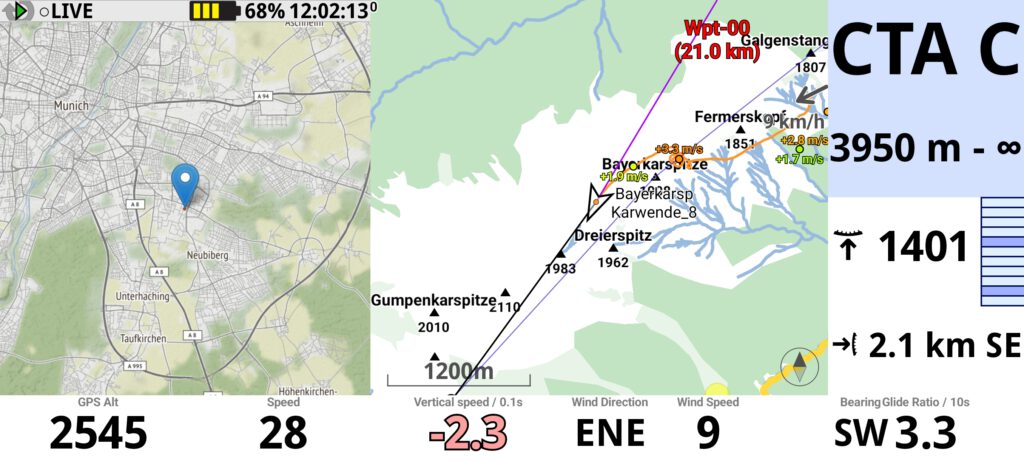
Page layout 1
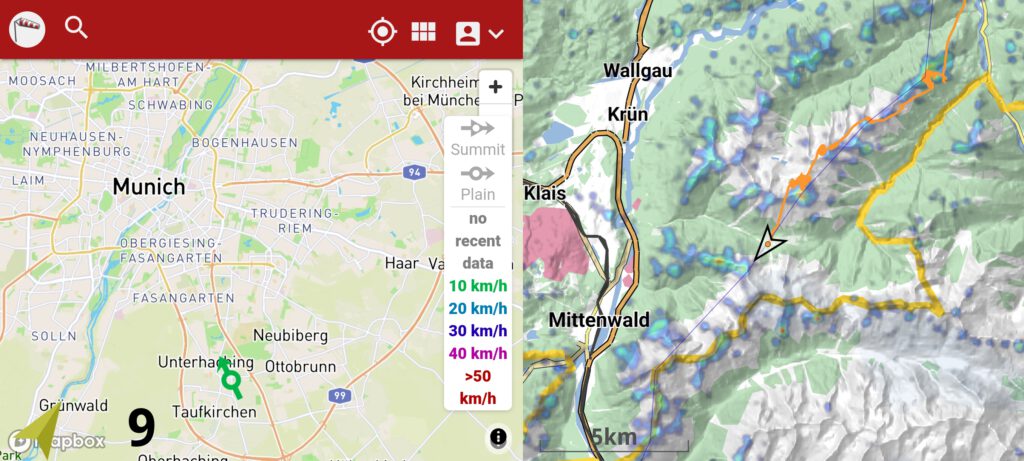
The page layout is displayed in straight flight.
On the left side, the website of Thermik Pumpt is displayed. According to the developer, it should offer real added value while flying in the mountains to find the next thermal. I use the developer’s recommended zoom factor of 11. So far I have not been able to take advantage of the thermals display, but that may come, as I have only been using the website while flying for a month. According to the developer, the thermal display does not bring any advantages in the flatlands.
The XC map in the middle is only supposed to show the most important terrain features for orientation in the field, so “Display road map”, “Show alert screen when approaching obstacle”, “Display cities” and “Display takeoffs” are activated. As the XC map is displayed during straight flight, “Display waypoints”, “Draw a navigation line” and “Show bearing (course)” are enabled to display the planned route and waypoints. Furthermore, “Mark glide distance” to estimate whether reaching the mountains on the other side after crossing the valley is realistic. For information, I have activated “Display nearby pilots” and “Display tracklogs of selected pilots”, even though I have never used the latter. I have deactivated almost all other displays so as not to overload the XC map with information.
At the bottom right, the bearing is displayed, in case I do get sucked into a cloud, it might be useful to leave it again on a straight path. Some pilots have a compass installed on the cockpit for this purpose, but the bearing is distorted by a variety of external influences.
To the right, the glide ratio is shown with an average of 10 seconds, so that I can estimate whether I am flying well in a straight line. Theoretically, it could help with dolphining, but I think that’s really only theoretical.
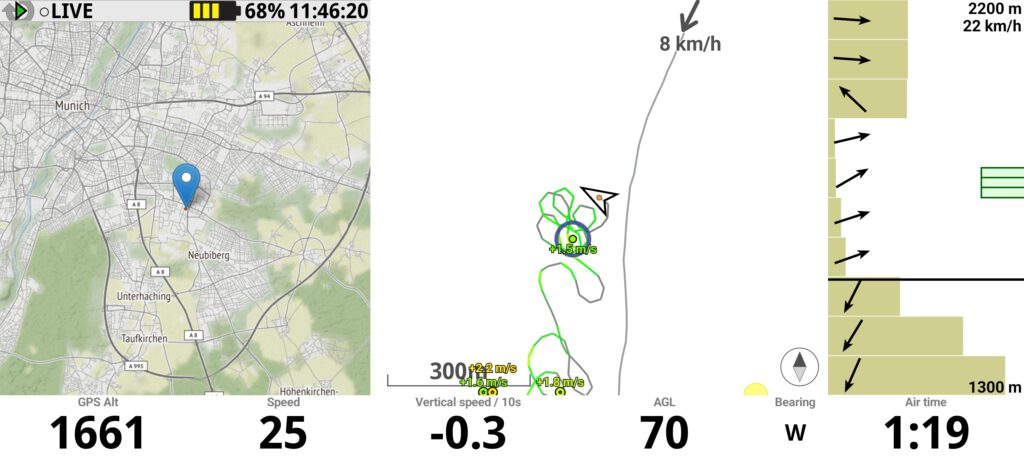
Page layout 2
The page layout 2 is switched to as soon as I turn in the thermal.
Here, too, the Thermik Pumpt web page is displayed in order to be able to estimate whether the next thermal is within reach when cranking in the current thermal.
The Thermal Wizard is displayed in the centre. I have set the parameter “How to include wind into computation:” to “Classic”. In stronger winds and in the mountains, this helps only to a limited extent. Sometimes it helps me to find the lost thermals again, sometimes not. I also have the wind arrow displayed, but my experience there is rather mixed. Regardless of whether the wind is calculated by the XC Tracer or XC Track, I often have the impression that the indicated wind strength and direction are not correct. With both the wind indicator and the thermal indicator, I have the impression that they work better in the lowlands.
At the bottom in the middle, I have the vertical speed averaged over 10 seconds displayed so that I can better assess whether I have centred the thermals well.
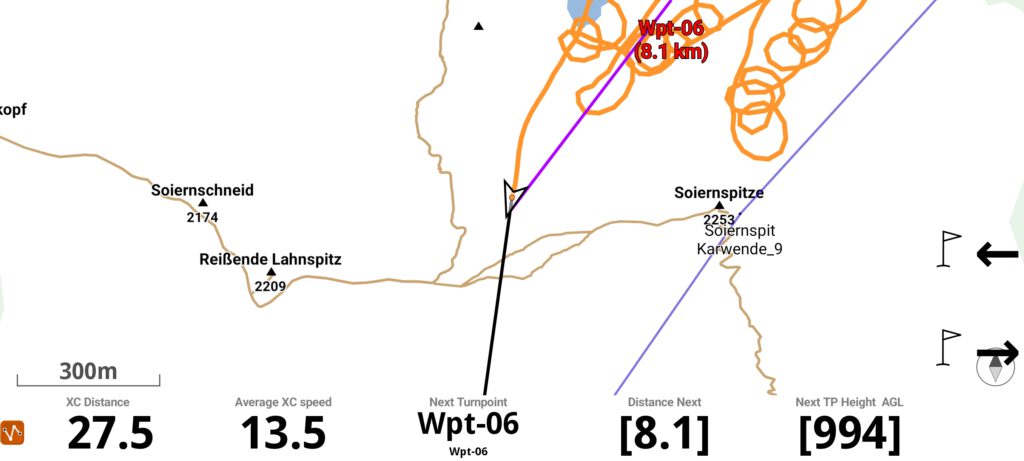
Page layout 3
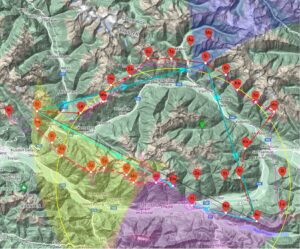
The task map on this page layout is intended to give me an overview of the waypoints flown so far and the waypoints that are still planned. Therefore, only waypoints, the route and the displays used for navigation are shown. On the right, the navigation buttons waypoints forward and back are highlighted.
Page layout 4
On the left-hand side, the winds.mobi website is displayed to show all available wind gauges recorded with winds.mobi in the area. This is to allow me to estimate the displayed wind strength and direction in page layout 1 and 2 for accuracy.
On the right is XC map with “Display basic thermal overlay (thermal.kk7.ch)” and “Display rain radar data” activated. Maybe the KK7 thermal points help me to find the next thermal, but one should not overestimate the function. Showing the rain can be very useful, especially in the mountains, as a rain area may already be waiting for you in the next valley. Only in this overview is “Display terrain map” activated, which otherwise tends to make the maps look cluttered and confusing.
Page layout 5
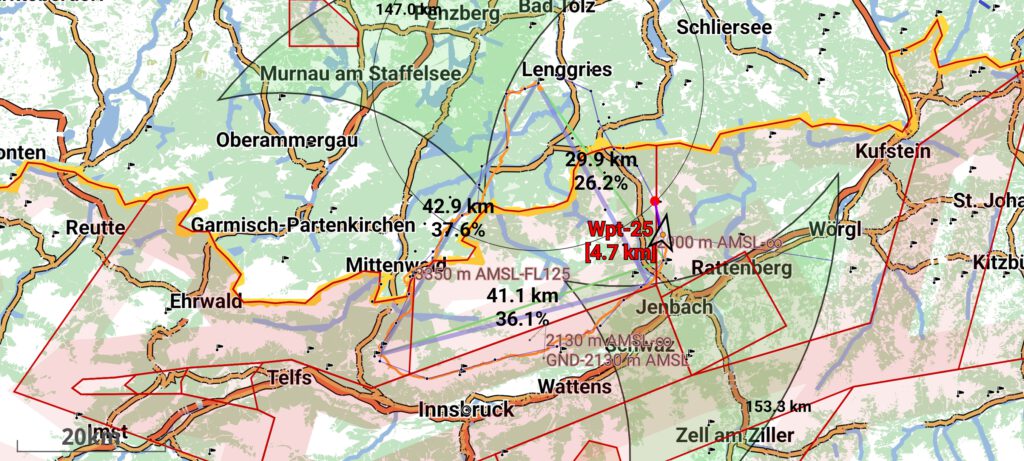
The XC chart in this layout should show the entire route, waypoints, FAI sectors and airspaces in overview, therefore the checkbox “Automatic scaling to fit the entire tracklog” is activated.

Gibt’s die cfg Datei auch als Download?
Bernd
Hallo Bernd,
ich habe eine Lösung gefunden, die komplette XC Track Konfiguration kann oben heruntergeladen werden.
Gruß,
Oliver